PLAIT PRESS · DATA KIT · OCTOBER 2026
Plait wearable data kit: free charts and numbers
Six charts, and the numbers behind them, from wearable data synced to Plait, a meal-plan app: WHOOP recovery and sleep from up to 765 WHOOP owners, and estimated calorie burn and sleep from up to 165 Garmin owners, between August 11 and October 19, 2026. These are device estimates from a self-selected group of WHOOP and Garmin owners who use a meal-plan app, not a representative sample. They show patterns, not causes. Every figure is an aggregate of at least 30 users; no individual’s data is published.
- Generated October 18, 2026
- 6 charts, PNG (1600×900) and SVG
- All figures as CSV
- Methodology
Free to use with credit: Source: Plait (plait.fit)
Journalists, podcasters, creators and dietitians can use these charts and numbers in articles, episodes, posts, slides and newsletters without asking. Please keep the source line, the sample size and the date window with any figure you quote, and link to plait.fit where you can. Resize or crop the images freely; please don’t change the numbers.
Chart 1 · WHOOP
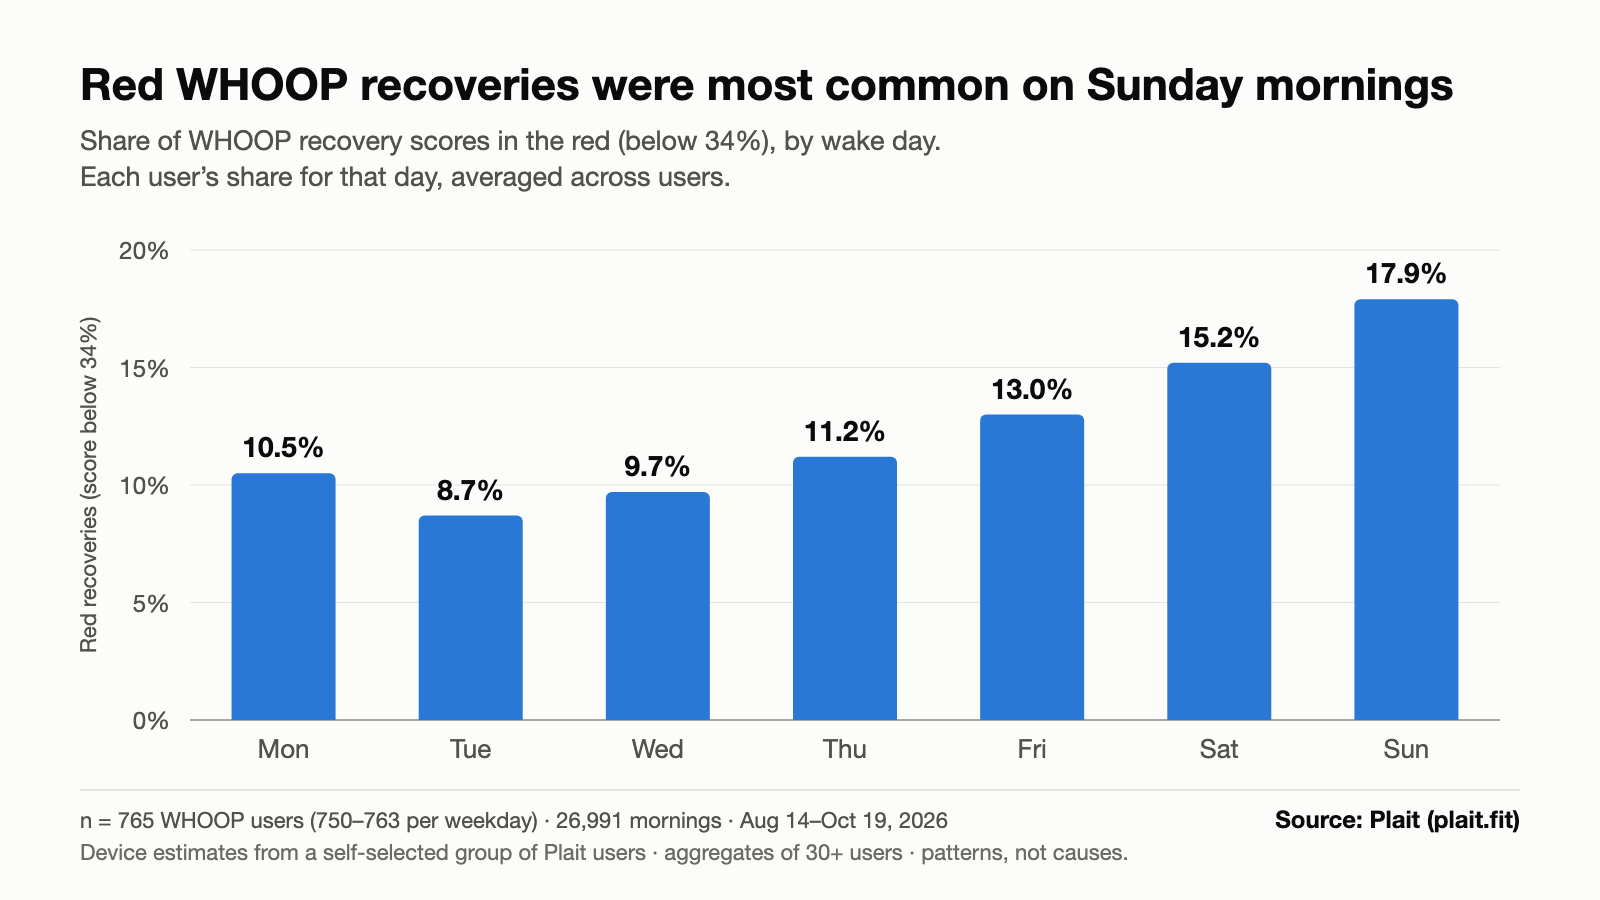
Sunday mornings had about twice the share of red WHOOP recoveries of Tuesday mornings
| Mon | Tue | Wed | Thu | Fri | Sat | Sun |
|---|---|---|---|---|---|---|
| 10.5% | 8.7% | 9.7% | 11.2% | 13.0% | 15.2% | 17.9% |
- Sunday 17.9% vs Tuesday 8.7% (2.1×). Pooling all mornings together instead gives Sunday 17.7% and Tuesday 8.1%.
- Across all days, 12.2% of recovery scores were red, and 36.3% of users averaged at least one red morning a week.
- n = 765 WHOOP users (750–763 per weekday), 26,991 recovery scores, wake days August 14–October 19, 2026.
What it shows: in this group, red recovery scores were more common toward the weekend and least common early in the week; the data does not show why.
Free to use with credit: Source: Plait (plait.fit)
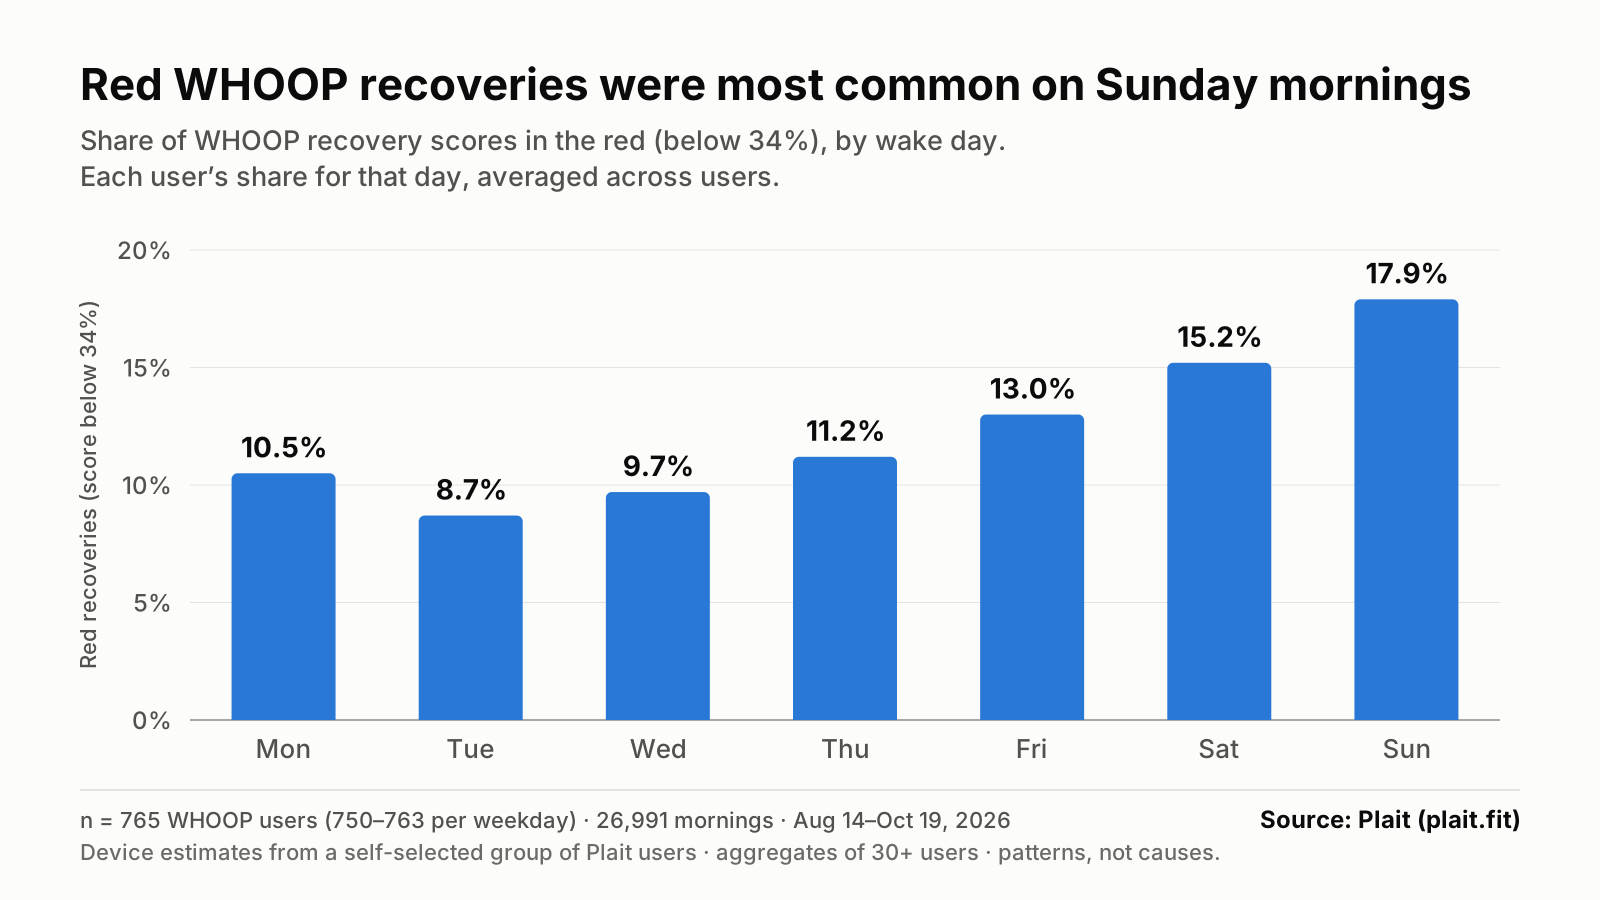
Chart 2 · WHOOP and Garmin
Close to half of tracked nights were under 7 hours of measured sleep, on WHOOP and on Garmin
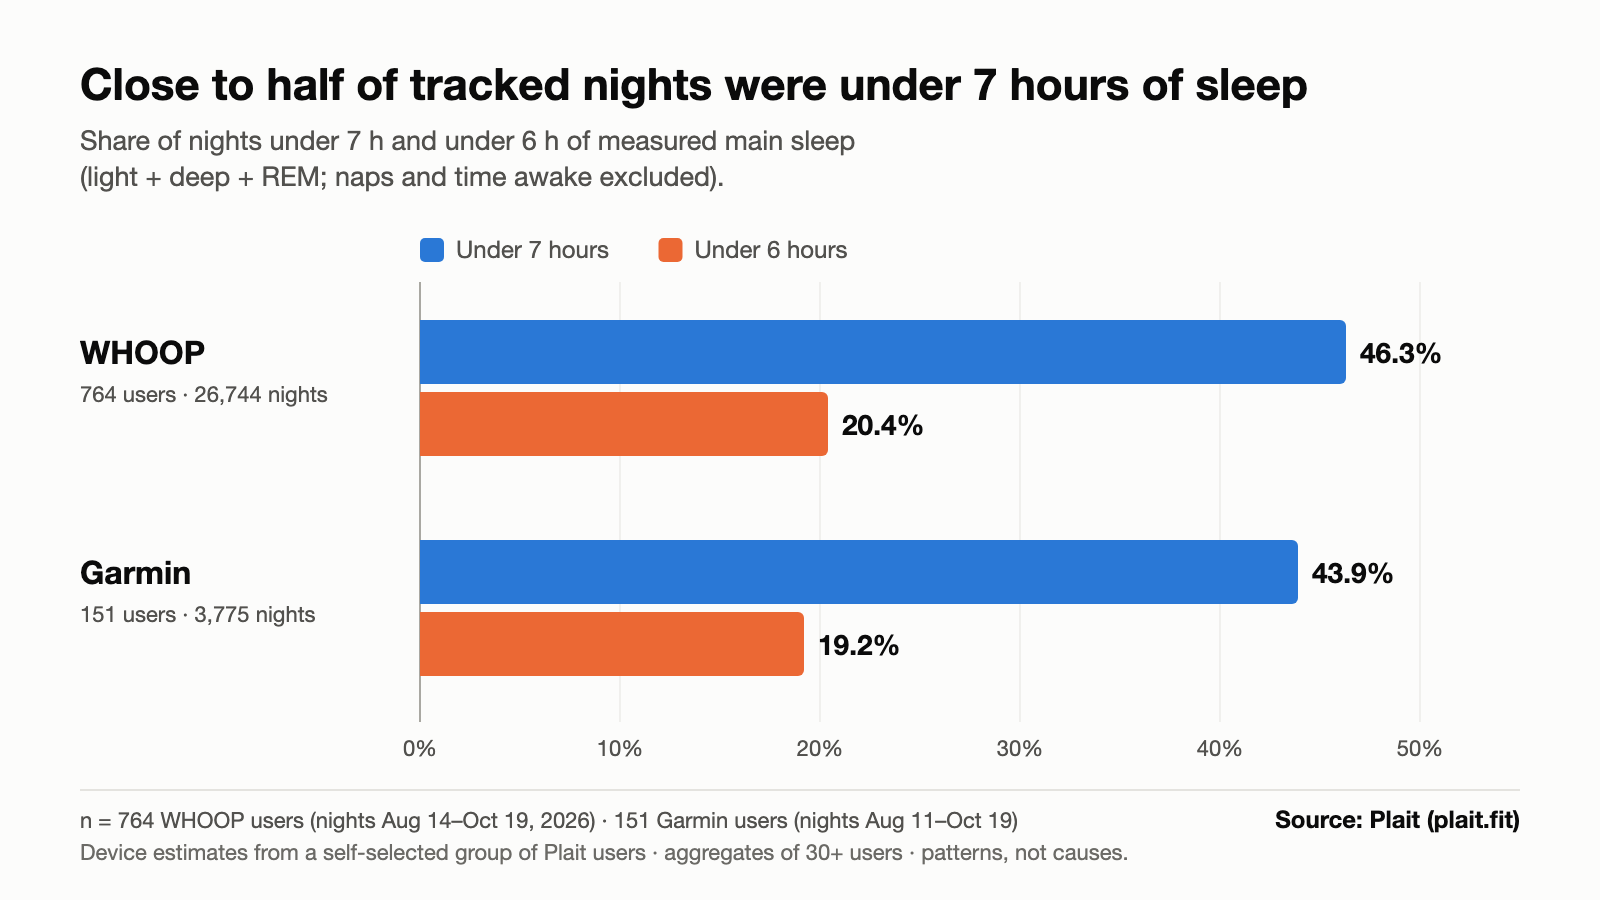
- WHOOP: 46.3% of 26,744 nights were under 7 hours and 20.4% under 6 hours; 764 users; nights August 14–October 19, 2026. The median user’s typical night was 7.12 hours.
- Garmin: 43.9% of 3,775 nights were under 7 hours and 19.2% under 6 hours; 151 users; nights August 11–October 19, 2026. The median user’s typical night was 7.16 hours.
- n = 764 WHOOP users and 151 Garmin users, each with at least 3 nights.
- Weekend catch-up was small: the median Garmin user slept 16 more minutes on Saturday and Sunday wake-ups (137 users), the median WHOOP user 8 more minutes (750 users).
What it shows: measured sleep (time asleep, not time in bed) fell short of 7 hours on close to half of nights in both groups, even though the typical user’s median night was just over 7 hours.
Free to use with credit: Source: Plait (plait.fit)
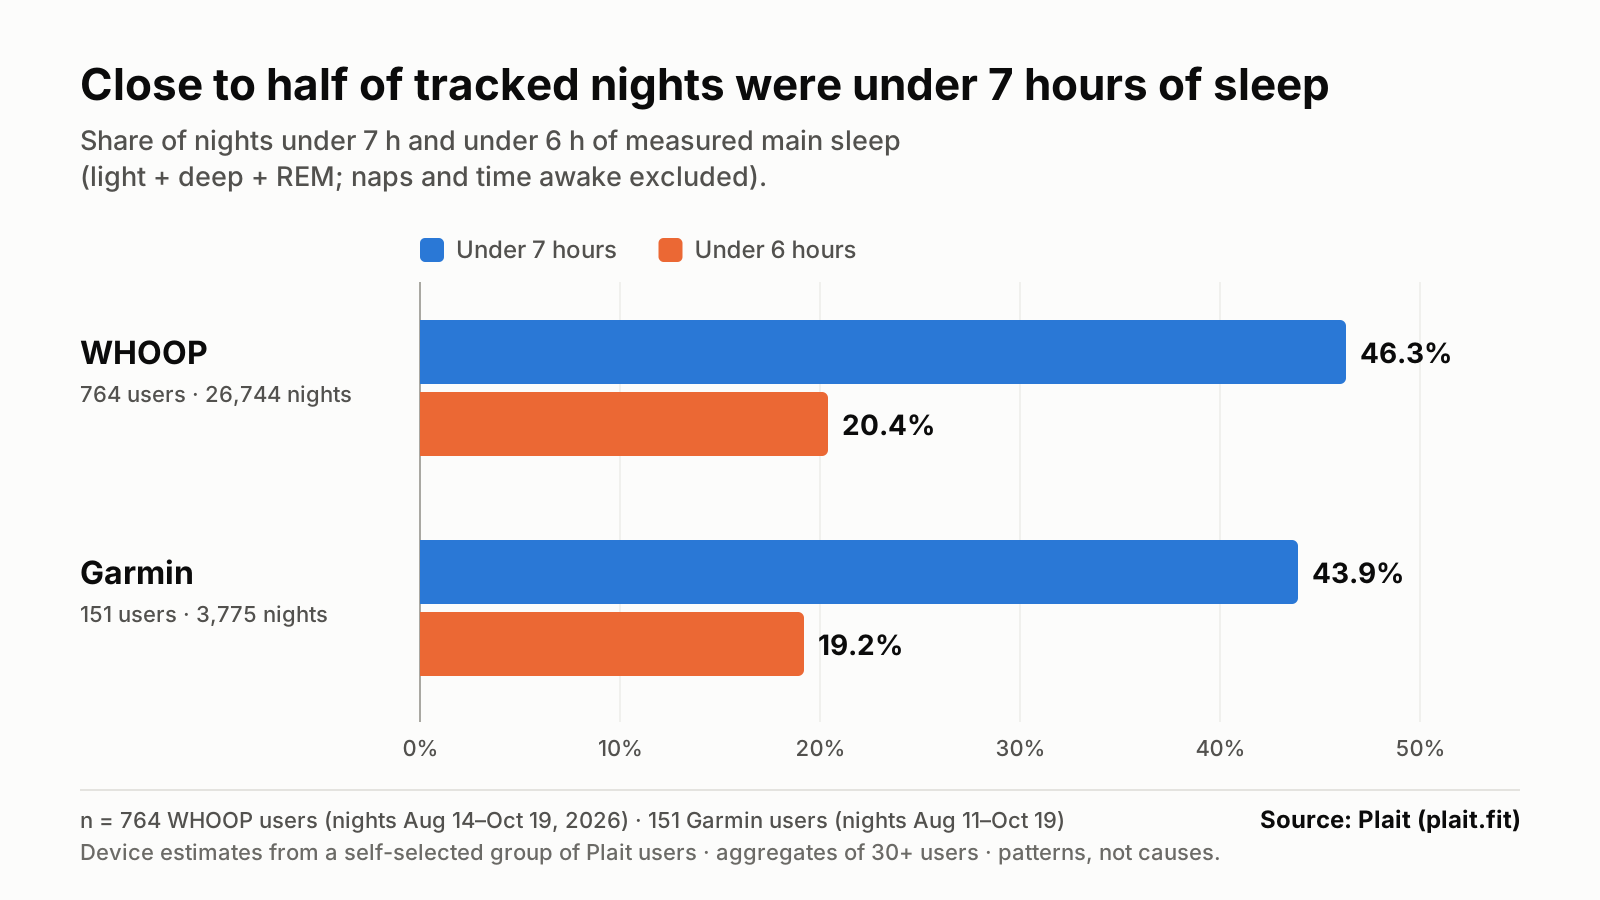
Chart 3 · WHOOP
After a strain-14+ workout, the median WHOOP user’s next-morning recovery was 11 points lower than after a day with no logged workout
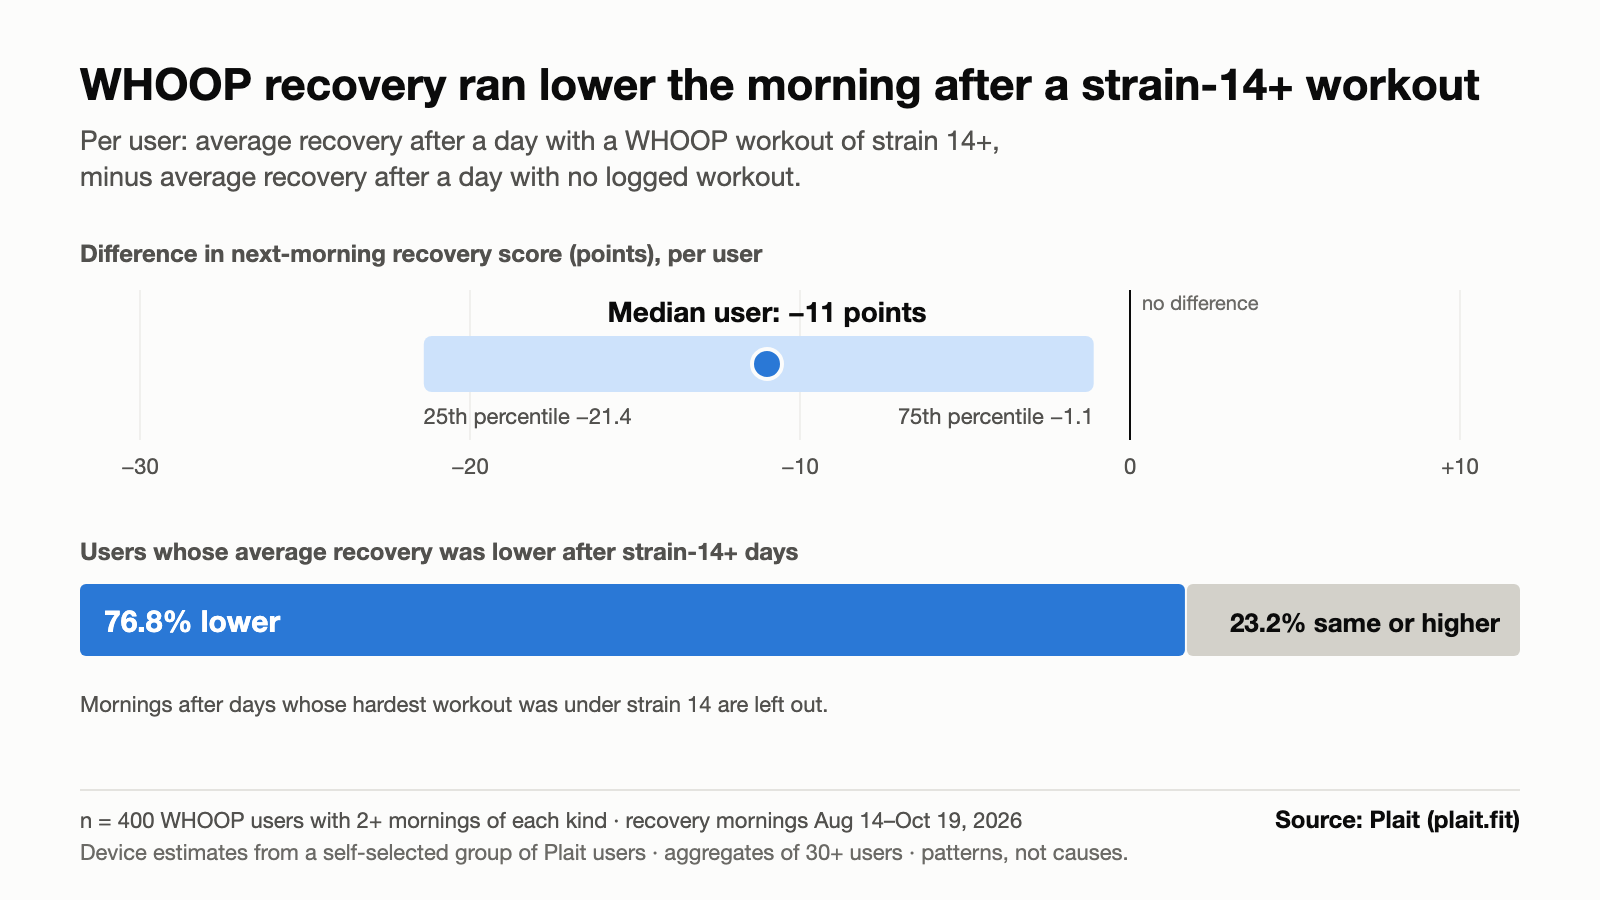
- Median difference −11 recovery points; middle half of users −21.4 to −1.1 points.
- 76.8% of users had lower average recovery after strain-14+ days than after no-workout days.
- n = 400 WHOOP users with at least 2 mornings of each kind; recovery mornings August 14–October 19, 2026.
What it shows: within the same people, mornings after hard workout days tended to carry lower WHOOP recovery scores; it is an association between two device scores, not a measure of fitness or health.
Free to use with credit: Source: Plait (plait.fit)
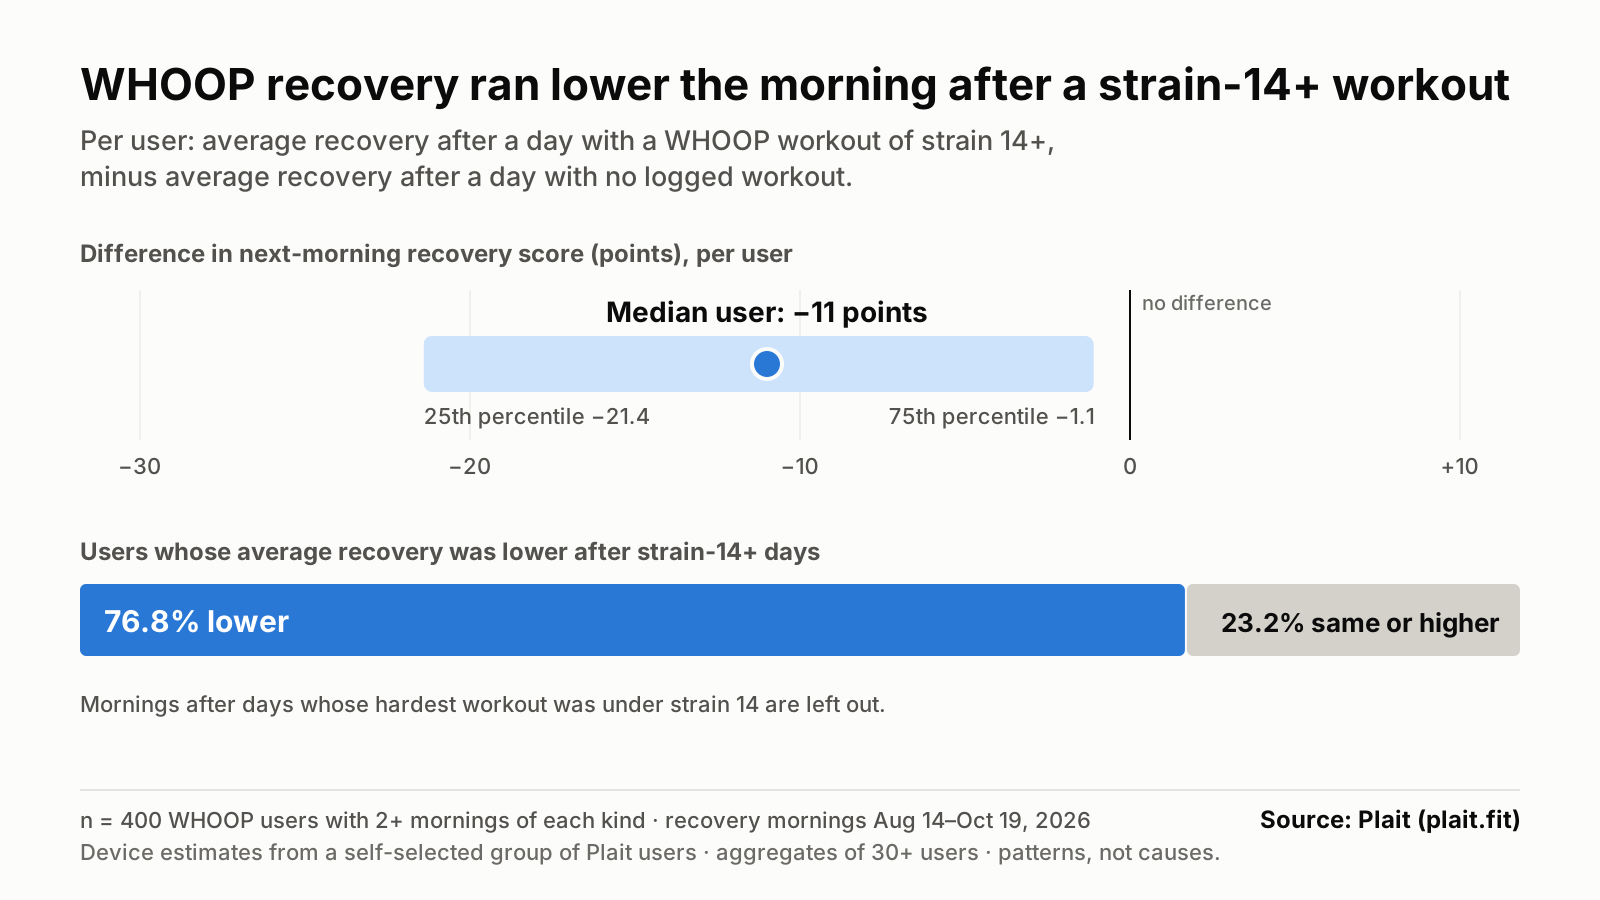
Chart 4 · Garmin
The median Garmin user’s highest-burn day was 712 kcal above their lowest day in the same week
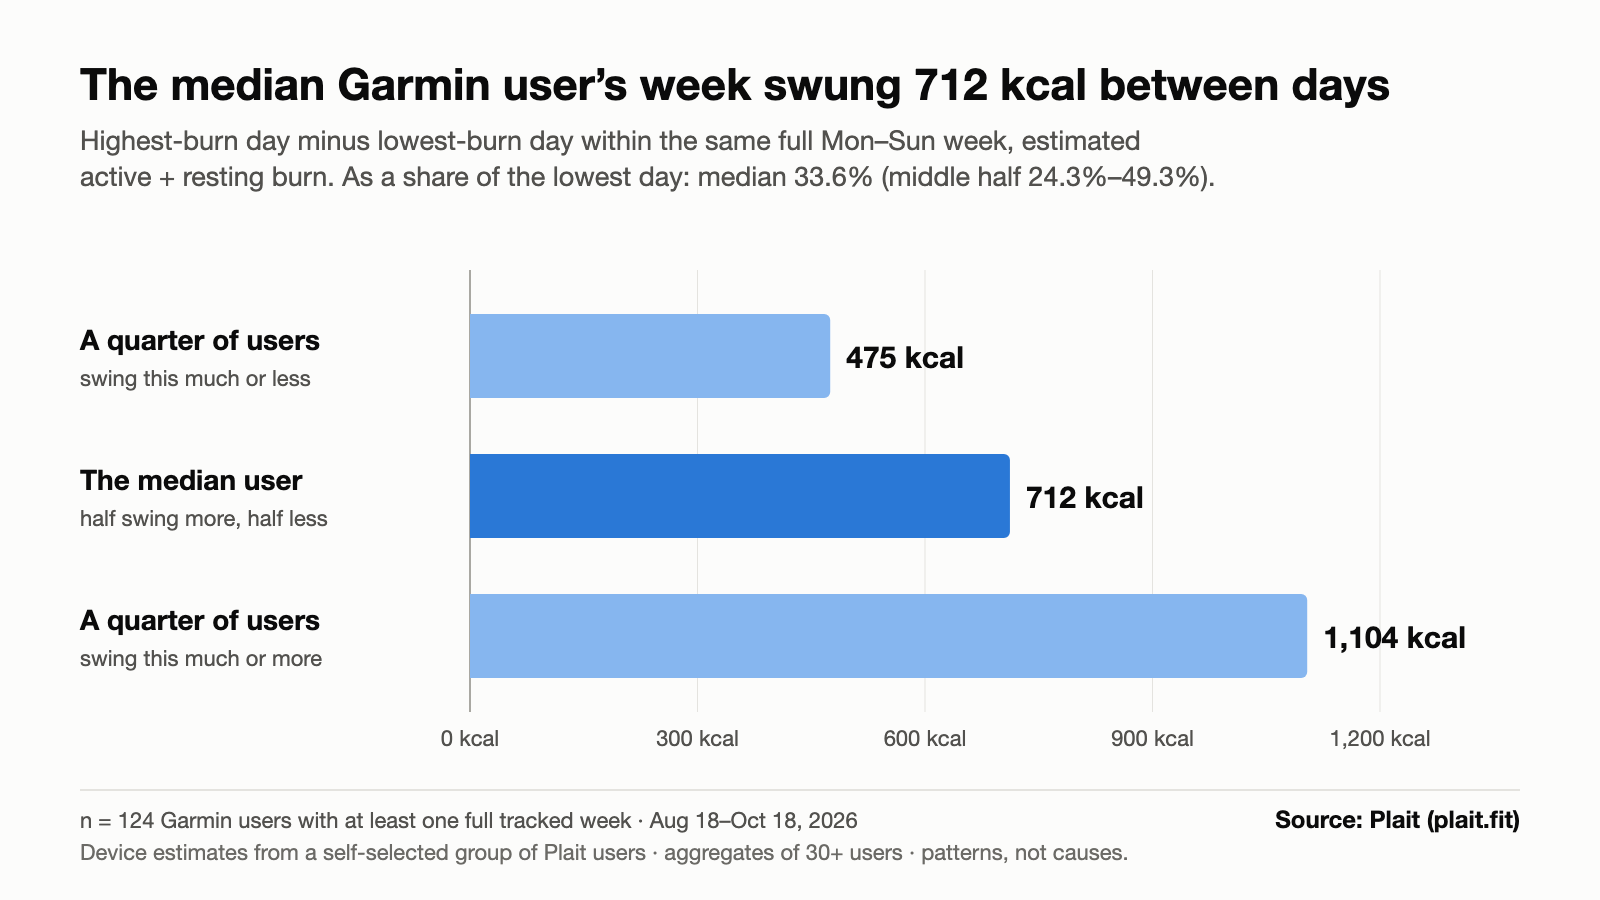
- Median swing 712 kcal; middle half of users 475–1,104 kcal.
- As a share of the lowest day: median 33.6% more; middle half 24.3–49.3%.
- Weekends and weekdays were close on average: a median difference of +25 kcal a day (148 users).
- n = 124 Garmin users with at least one full Monday–Sunday week of complete days; August 18–October 18, 2026.
What it shows: for the same person, the watch’s estimate of a day’s burn varied widely from one day to another within a single week.
Free to use with credit: Source: Plait (plait.fit)
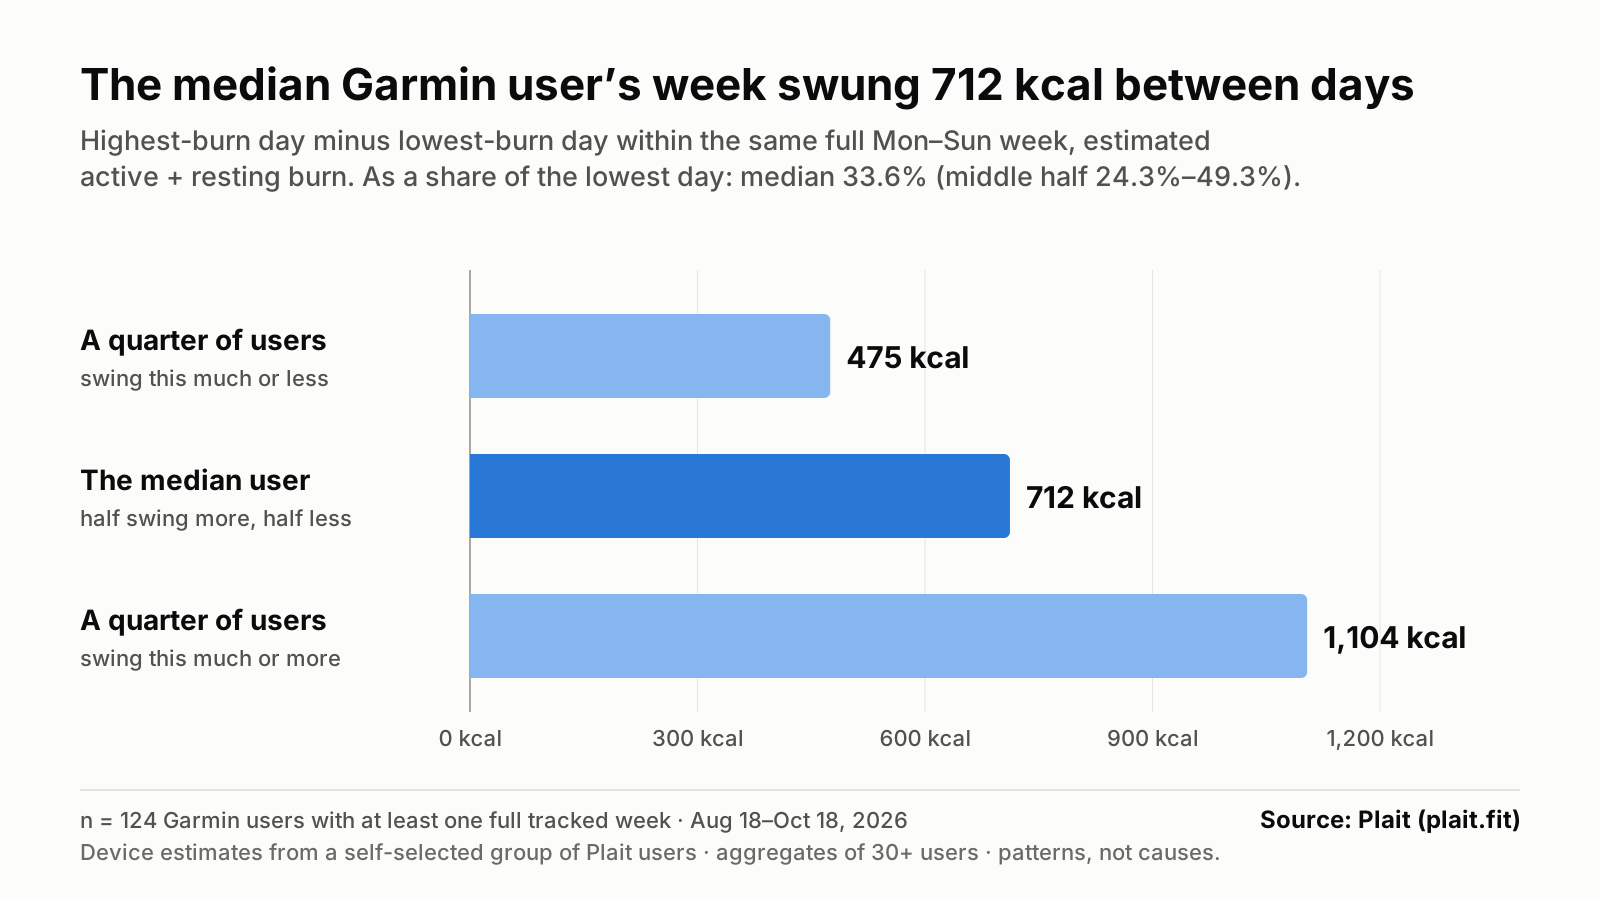
Chart 5 · Garmin · Early look, 78 users
Early look, 78 users: a standard calorie formula came in below Garmin’s estimated daily burn for 87.2% of them
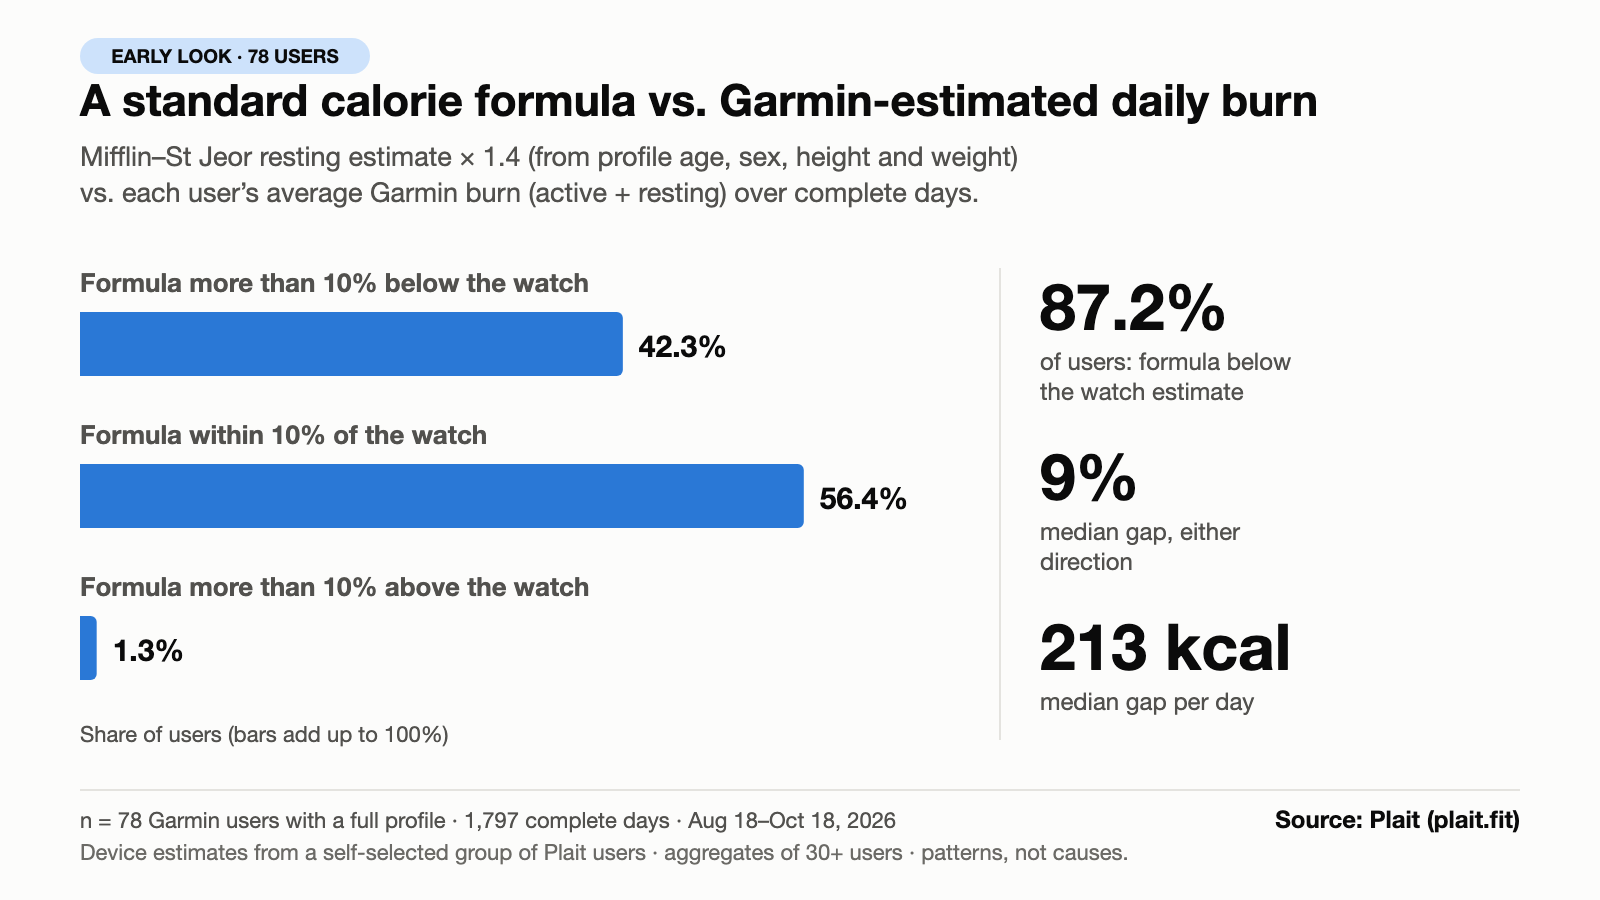
- Formula (Mifflin–St Jeor resting estimate × 1.4, from profile age, sex, height and weight) vs each user’s average Garmin burn (active + resting) over complete days.
- Median gap 9% in either direction (about 213 kcal a day); formula lower than the watch for 87.2% of users.
- More than 10% below the watch: 42.3%. Within 10%: 56.4%. More than 10% above: 1.3%.
- For the same 78 people, Garmin’s own resting (BMR) estimate ran a median 22% above the Mifflin–St Jeor resting estimate.
- n = 78 Garmin users with a full profile; 1,797 complete days; August 18–October 18, 2026.
What it shows: in this small group, the textbook formula and the watch disagreed by about 9% for the typical person, mostly with the formula lower. Neither number is a measurement of metabolism, and Garmin’s figure is itself partly formula-based.
Free to use with credit: Source: Plait (plait.fit)
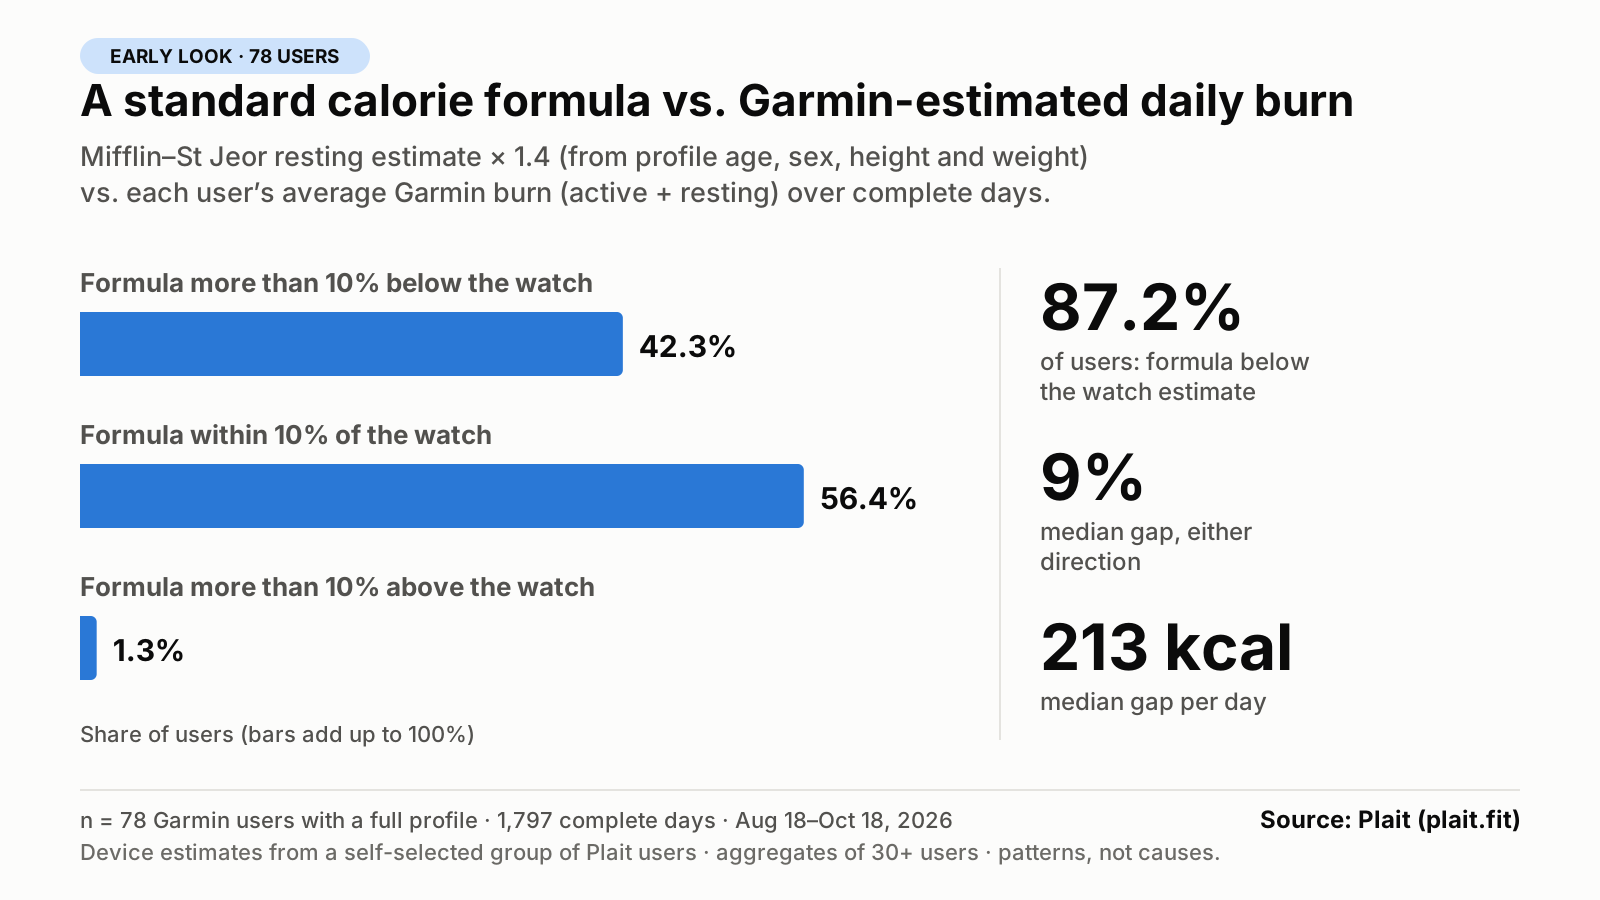
Chart 6 · Garmin
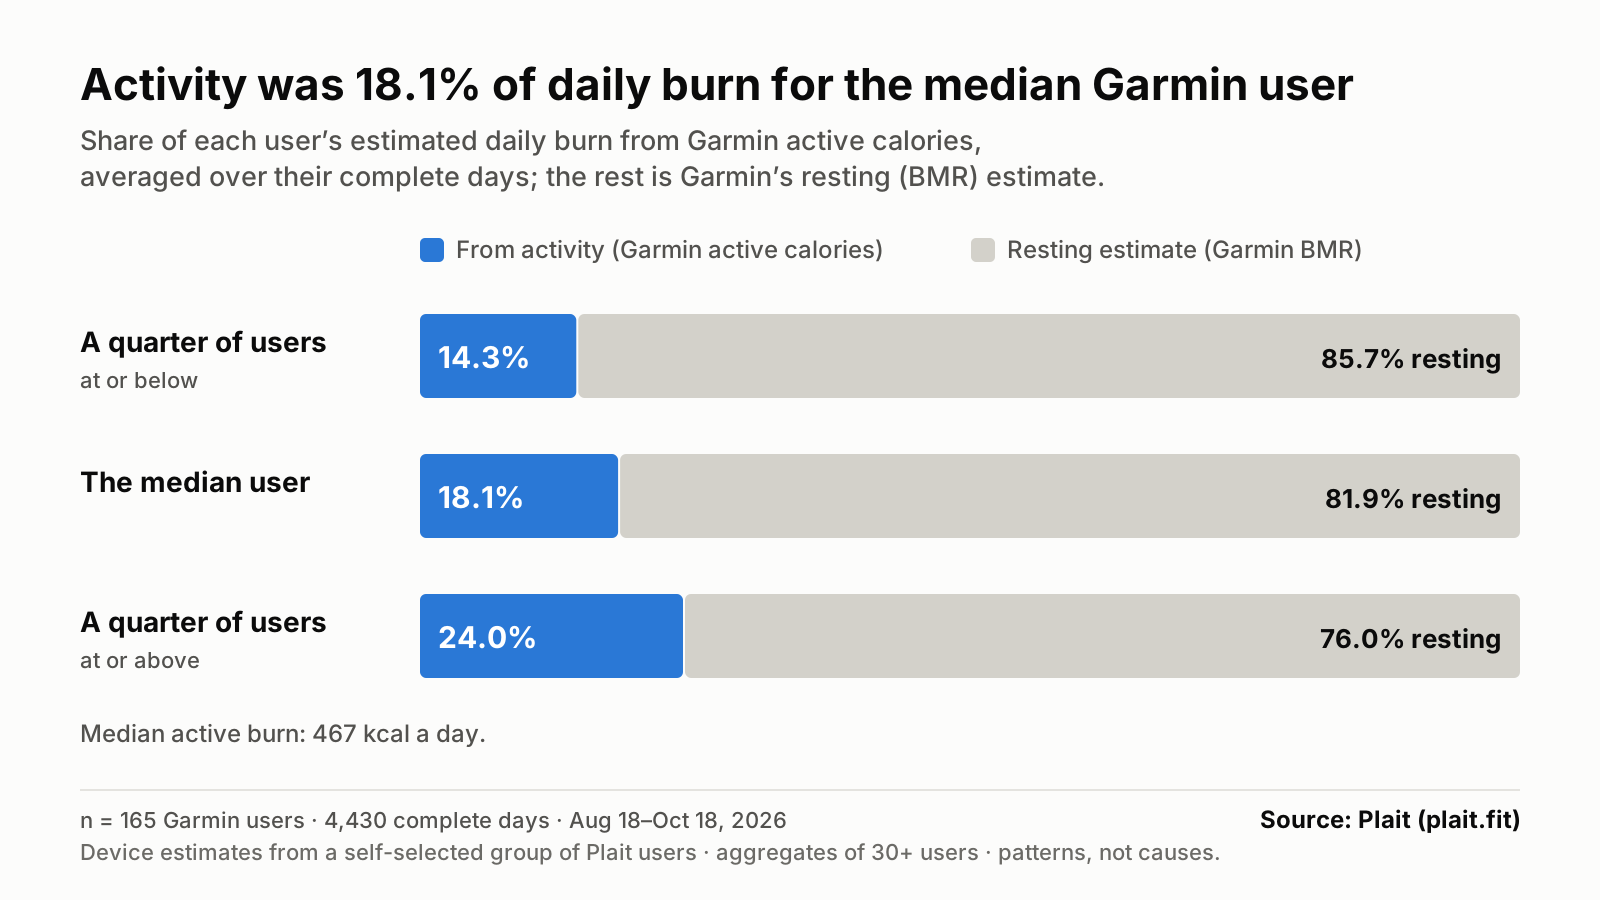
Activity made up 18.1% of estimated daily burn for the median Garmin user; the rest was the watch’s resting estimate
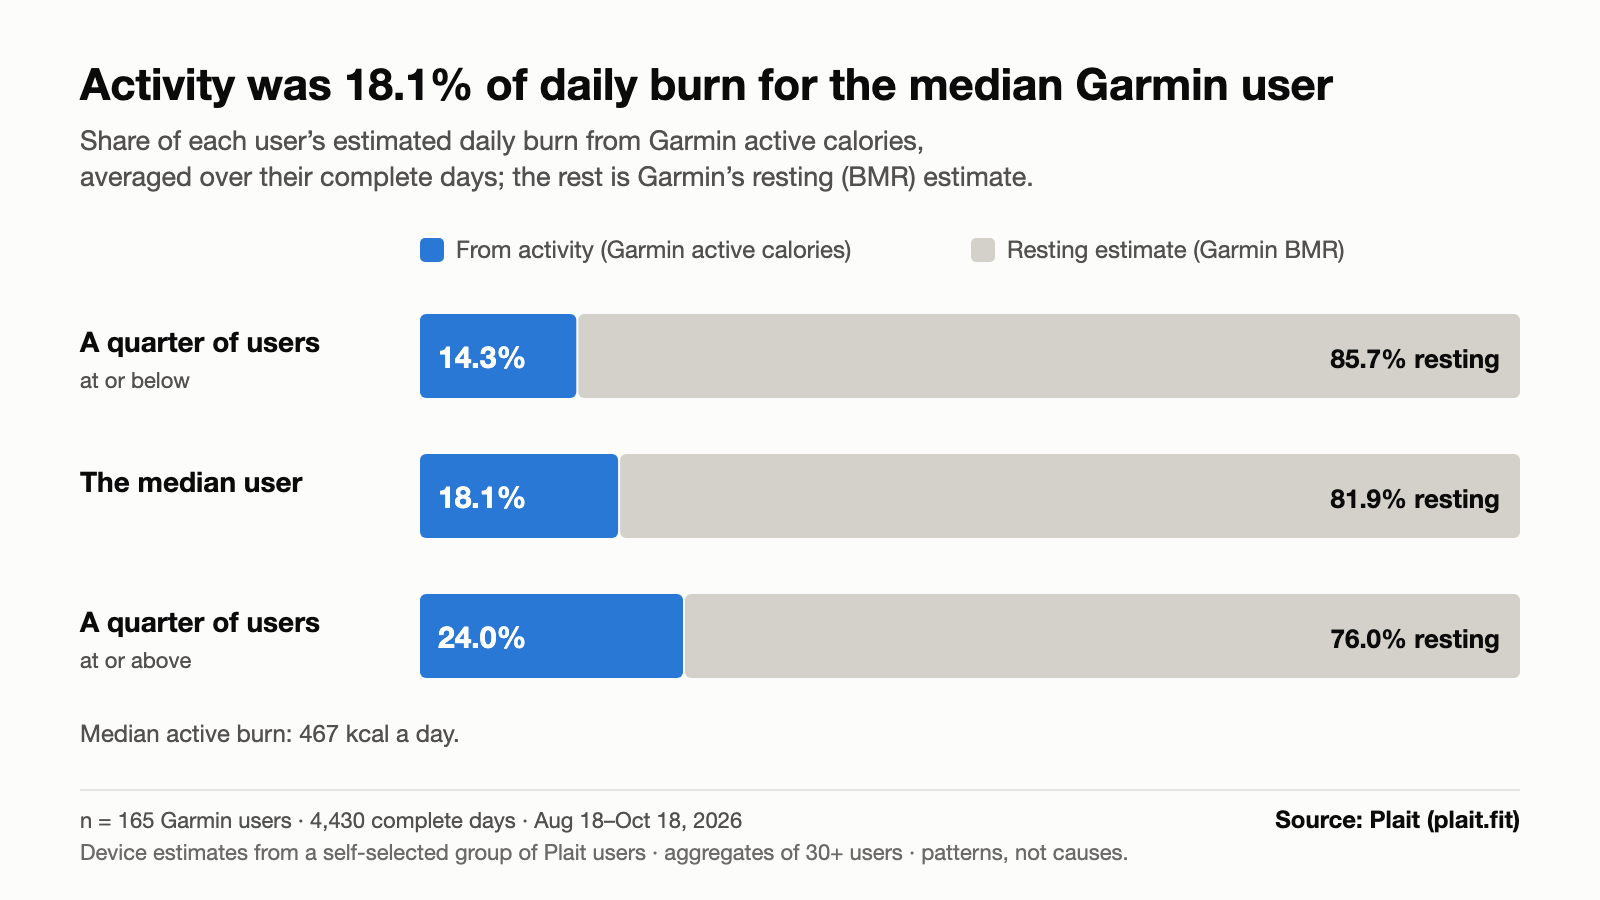
- Median activity share 18.1%; middle half of users 14.3–24.0%. Only 9.1% of users got more than 30% of their estimated burn from activity.
- Median active burn 467 kcal a day (middle half 342–634 kcal).
- n = 165 Garmin users; 4,430 complete days; August 18–October 18, 2026.
What it shows: in Garmin’s accounting, the resting estimate made up most of each day’s burn for most users in this group.
Free to use with credit: Source: Plait (plait.fit)
Methodology
Figures come from one read-only aggregation of the data Plait users’ WHOOP and Garmin accounts had synced, run on October 18, 2026. Owner, staff and test accounts are excluded. Only totals, shares and percentiles leave the aggregation; no names, emails or individual records.
Definitions
- 30-user floor
- Every published figure is built from at least 30 distinct users; anything smaller is suppressed. Apple Watch had too few users for any figure, so it is not in this kit.
- Red recovery
- A scored WHOOP recovery below 34% (WHOOP’s red band; green is 67% or higher). Calibrating scores are dropped. Each score is dated by the local wake day of the sleep it belongs to. The weekday chart averages each user’s red share for that day, so heavy users don’t dominate; pooled shares are in the CSV.
- Sleep
- Main sleep per wake date, naps excluded: light + deep + REM sleep, so time awake in bed doesn’t count. Nights under 3 or over 14 hours are dropped as implausible; users need at least 3 nights. Shares of nights under 7 or 6 hours are pooled across all nights.
- Complete days (Garmin)
- Finished local days only (never today), with a full-day Garmin summary (at least 23.5 hours) and a total between 1,200 and 6,000 kcal; 101 partial days were dropped. Daily burn = Garmin active calories + Garmin resting (BMR) calories.
- Strain 14+ vs no workout
- Per user: average recovery on mornings after a day whose hardest scored WHOOP workout had strain 14 or more, minus mornings after a day with no logged workout, within the span the user logs workouts. Mornings after lighter workouts are left out. Users need at least 2 mornings of each kind; the chart shows the spread of those per-user differences.
- Weekly swing
- For users with at least one full Monday–Sunday week of complete days: the highest day minus the lowest day in each week, the user’s median across weeks, then percentiles across users. The percentage is relative to the lowest day.
- Formula vs watch
- Mifflin–St Jeor resting estimate from the age, sex, height and weight in the user’s Plait profile, × 1.4 (the activity factor Plait uses as a fallback), compared with the user’s average complete-day Garmin burn. Users need a valid profile and at least 3 complete days.
- Activity share
- For each complete day, Garmin active calories ÷ (active + resting calories), averaged per user over at least 3 days, then percentiles across users.
- Medians and the middle half
- Unless stated, figures are first computed per user, then summarized across users: the median, and the 25th–75th percentiles (“middle half”).
Windows
- WHOOP recovery: wake days August 14–October 19, 2026 (26,991 scores, 765 users). WHOOP sleep: August 14–October 19, 2026 (26,744 nights, 764 users).
- Garmin sleep: August 11–October 19, 2026 (3,775 nights, 151 users).
- Garmin burn: complete days August 18–October 18, 2026 (up to 165 users).
- Dates are users’ local dates, so wake days in time zones ahead of UTC reach October 19.
Biases and limits
- Self-selected: people who own a WHOOP or Garmin and signed up for a meal-plan app. Recent signups are mostly Garmin owners reached through Instagram ads. This is not a representative sample of wearable owners or of the public.
- Device estimates: calories, sleep stages, recovery and strain are the devices’ own estimates, not lab measurements of metabolism or sleep.
- Garmin’s resting calories come from the profile people entered on Garmin, so part of Garmin’s “burn” is itself formula-based.
- Figures are not adjusted for age, sex, season or anything else. They cover late summer and early autumn 2026 only.
- Weekday patterns can also reflect when people wear, charge or sync a device.
- Associations only. Nothing here shows cause or a health outcome, and none of it is medical or nutrition advice.
Want a cut for your audience?
Write to support@plait.fit. We can split these figures by device or by sex where each group still has at least 30 users. Aggregates only: we never share individual data.
About Plait
Plait builds a meal plan from your real WHOOP, Garmin or Apple Watch (beta) burn: the calorie target comes from recent complete days your watch recorded, or a labelled estimate when there aren’t enough, and every meal comes with weighed portions. The weekly plan is free; Pro adds more meal tools. Plait is run day to day by its AI CEO; read how on the About page.